“As a general rule, the most successful man in life is the man who has the best information.” – Benjamin Disraeli
Making meaningful business decisions is going to be more important than ever this year. Organizations around the world are bustling with innovation; technology lets teams take their ideas to market quicker than ever before—all of which pushes the needle of industry competiveness to High.
And so, organizations rely on a wealth of information to maximize their efficiency, gain a competitive edge, nurture business relationships and boost their bottom line. As project performance can be critical to that bottom line, the focus is often on the information that originates in the project teams, and resides with teams and individuals tasked with managing and leading those projects.
Soooo much data
With current tools and methods, data is abundant and sometimes overwhelming: How do you take a sip when you’re drinking from a fire hydrant? This is the challenge: how best to take all the available data from various sources and convert it into meaningful information that feeds the many differing needs of their stakeholders.
It’s not about information quantity; it’s about information quality. Poor quality information leads to poor quality decision making.
Find the data that matters
Information has to be reliable, timely and audience appropriate. Therefore, you’re unlikely to be able to provide a one-size-fits-all type of report that will give you what you need as a project manager or team director, and meet the information needs of your team members, departmental and senior managers and your customer.
So what do you do?
Schedule lengthy review meetings involving half the company while you go through anything and everything project related so you cover all possible bases?
Unless you’re part of a small business where everyone has the same information interests, this is a great way to squander a lot of productive time. You’ll spend way too much time prepping for these reviews and wrangling all that information from various silos to deliver The Great Report to a mixed audience? You have more productive things to do with your time.
A starting point
To start, you need to pause for thought and consider what your different stakeholders information requirements are, then choose a project management software tool that can tailor the information outputs to meet those requirements.
That’s where LiquidPlanner comes in. It provides a number of built-in customizable reporting features that lets you surface the right data for the right people—and decision making.
Here’s an example of 5 key project questions LiquidPlanner reports helps you answer.
1. “Is my project on schedule?”
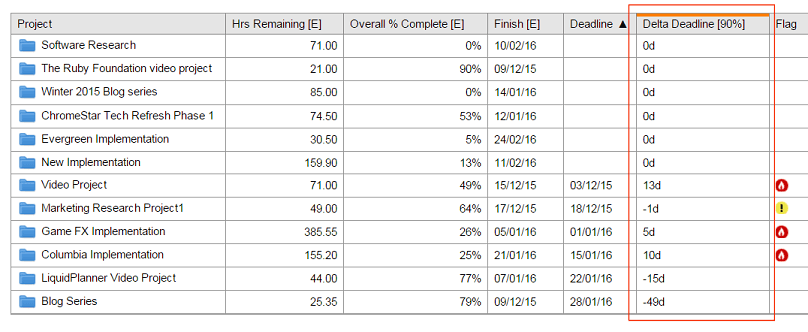
If anything in your project is running behind the projected end dates, you’ll know it. LiquidPlanner tags any at-risk plan items with a red schedule bar and flame alert in the Projects view—it’s an immediate visual cue that tells you that there are items at risk that need your attention. One of the ways you can use the Analytics feature is by creating a Roll-up Report that will show you how adrift of your deadlines you are:
2. “How can I can tell if my project is on budget?”
Profit will often be a key driver for your projects so you need a quick way to track your budget with your forecast and actual spends.
LiquidPlanner allows you to add a contract value for a project and establish Billing and Pay Rules so you can track the cost of hours worked and the revenue earned (Enterprise level customers can also incorporate non-labor line item Expenses into these reports):

3. “How can I share project status with my team members?”
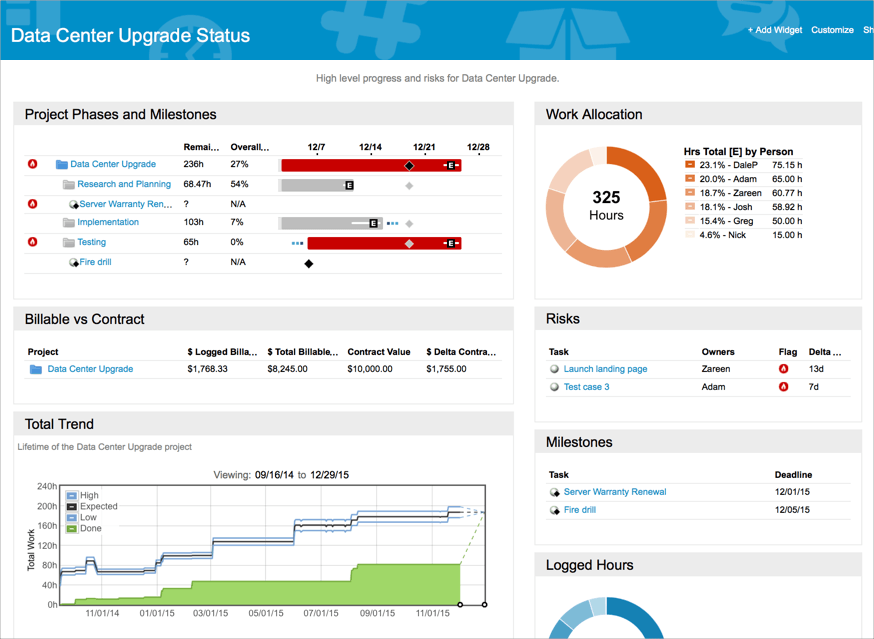
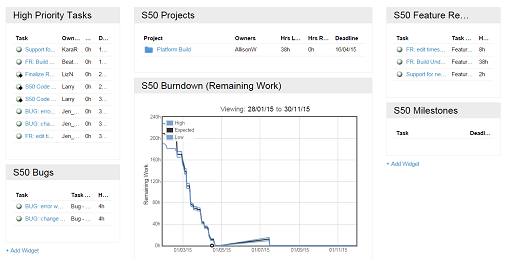
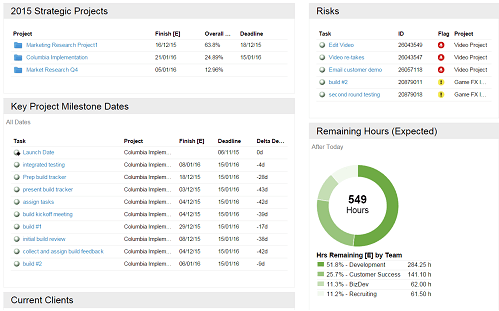
Dashboards are a flexible, high-impact visual way of displaying key project data that can be shared with your team. You can choose from a host of different widgets to show just the information that you and your team need to be focused on:
Think of dashboards as an information hub for your teams and team members and that information is updated in real time as work gets logged and remaining work gets added or re-estimated. Dashboards are, essentially, an instrument panel that’s flexible and always up to date.
4. “How can I share project status with my Senior Management Team?”
It’s crucial to your success that you manage stakeholder expectations. And chances are that your bosses will want a higher level view of your project world than your team members do. The top brass will want to see what’s in play that will impact the overall business, especially the risks.
You can generate and save Analytics Reports that your bosses and stakeholders can access at their leisure. Or why not have an Executive level view of the projects portfolio that just shows the headlines that they care about via a dashboard?
5. “How are my resources allocated across all our projects?”
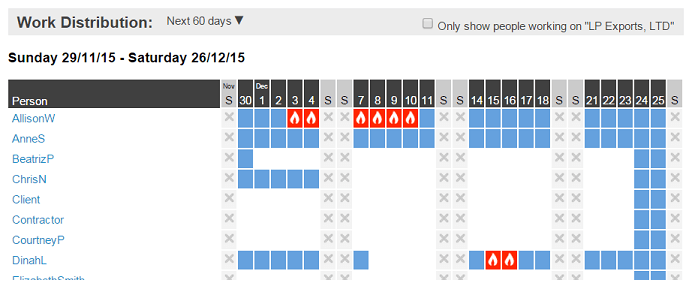
When you’re running a project, it’s essential to know how your resources are being allocated, in terms of current assignments and forward loading. This is the essential Who, What and When of all the moving parts that make up your project work.
LiquidPlanner’s Workload Report shows you where your resources are tasked and when they’re free so you can easily see where you have spare capacity (or not!) over the time period you select:
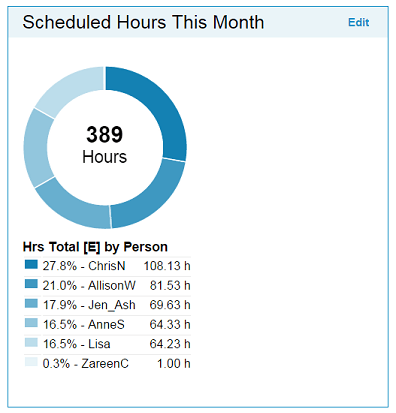
There are also various widgets that you can add to Dashboards to show your resource utilization and surface the projects that might be hoarding your team members’ availability:
All the reports we’ve sampled here are derived from the same source data in the workspace so the information is always in step regardless of the report type you choose. And that information is updated in real time as hours are logged and progress is updated across the workspace so it’s always current.
This is just a sample of how you can mine the rich resources of your project management workspace in LiquidPlanner and get the data you need to make key business decisions.
LiquidPlanner gives you access to all kinds of important project data. To learn how to get information around project status, how your team is doing, how your project is performing over time and what’s putting your project at risk, read:
Using LiquidPlanner Data to Monitor and Analyze Your Projects
