Release 34 | November 3, 2022
The major headline in this release is a bold new look for Dashboards. We’re so pleased with the results we decided to unlock the power of project and portfolio visualization for everyone using LiquidPlanner by making Advanced Dashboards available for all accounts, including those on the FREE Plan. Following a successful launch of the Open API in Release 33, our team has been hard at work expanding its capabilities. Grid and Workload views have been updated again – scroll down to learn what’s new!
Dashboards Reimagined
Dashboard optimizations in this release make it easier to showcase and export project data across the portfolio. They also pave the way for analytics and reporting features in the coming months. Read more here.
Open API Expansion
Share Planning Intelligence insights by integrating work metrics, scheduling and custom data into your digital ecosystem. Use the Open API to filter and download data for analysis or update plan items based on user actions in other systems. The Open API is included for Organizations with a paid ULTIMATE Plan. API Access is located under Administration in the left-side navigation.
The API team has been busy! Functionality is expanded to include:
- Filtering to see when entries were logged or updated
- Pulling a Timesheet Export in JSON format
- Creating a Project from a Template
- Duplicating Plan Items
- Managing Everyone Time-Off and Personal Time-Off (add, update, delete)
- Control over Dependencies & Wait Time (add, update, delete)
- Support for filtering by Custom Data Fields on plan items: Picklist, Multipicklist, Text, Date, Numeric, Checkbox, User
- Custom filtering enhanced to capture items with inherited custom field values
Check out the rest of our API updates in the API Changelog. Supporting documentation is located in the API Guide for LiquidPlanner New.
NEW! Packages & Subfolders added to Grid View
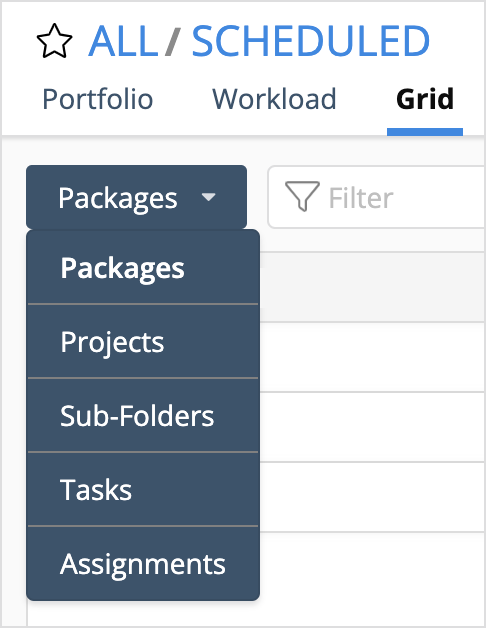
Grids are the go to view for examining project metrics and downloading data for further analysis. This highly customizable view offers over 40 data columns you can set in any order, then filter and sort to surface relevant information. There are Portfolio, Package and Project Grid Views. Use the drop down menu in the upper left corner of the Grid to select the hierarchy focus.
NEW: Package selection added to Portfolio Grids.
NEW: Sub-Folder selection added to Portfolio, Package and Project Grids.

Learn more in the Academy: Grid View
NEW! Predictive Schedule Column
Predictive Schedule is a new column making it possible to have the best of both worlds – your schedule, and as much data as you want to see, all in one view! You can choose whether or not to include the schedule bars or change where they sit in relation to the rest of the data by customizing the column display.
NEW: Display schedule bars inline with your plan item data on Grid Views and Dashboard List Widgets. This column is excluded when downloading Grid View.
CHANGED: Predictive Schedule column is being added as the first column in all Grid Views, including “Favorites”. Click Columns to update your display.

Learn more in the Academy: Grid View , Introduction to Schedule Bars, Target Dates
NEW! Project and Assignment Counts
Sometimes you just want to know, how many are there? Now you can find out! Count Projects, Tasks and Assignments in Grid Views, Priority Views and on Dashboards with Metrics Tally, Properties or List widgets.
NEW: Display the number of Total Projects, Scheduled Projects, Done Projects, On-Hold Projects in a Portfolio or Package.
NEW: Display the number of Active Assignments, Done Assignments, Total Assignments in Grid View for a Package, Project or Sub-Folder.
Learn about customizing columns in the Academy: Priority Views, Grid View and explore Dashboard options in the lesson about Widgets & Groups.
Workload View
As work and resources change, LiquidPlanner automatically levels your team’s workload across multiple projects and dependencies. Workload Views help you stay on top of it all by showing how everyone’s work is distributed over 30, 60, 90 and 180 days. LiquidPlanner users love long range planning and these Workload updates make it even easier:
CHANGED: The new default setting for Workload View is 60 days instead of thirty.
NEW: The user column is frozen, making it easier to keep track of what you’re looking at while scrolling through the Workload.
Learn more in the Academy: Workload View


